Understanding the role of key economic indicators in real estate investment analysis is crucial, given their significant influence on the real estate market. Factors such as overall economic growth, interest rates, inflation, and employment levels directly shape the demand for real estate. Notably, periods of high economic growth and low unemployment trigger increased demand for real estate, driven by enhanced purchasing power and market confidence.
Let’s examine the unemployment rate, labor force participation rate, and labor-population ratio, all of which are compiled by the US Bureau of Labor Statistics. While the calculations for these indicators are similar, they each provide unique insights into the labor market and the economy’s overall health.
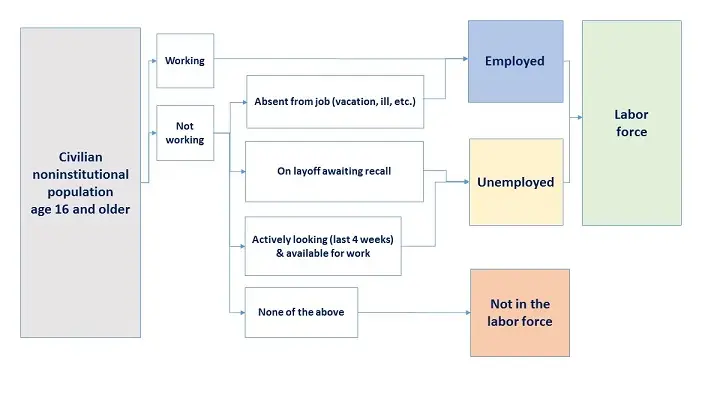
As we proceed through our discussion, we will refer to this chart.
1. The Unemployment Rate.
The unemployment rate, a key economic indicator, is calculated by dividing the number of unemployed individuals in the labor force (see the yellow box) by the total labor force (the sum of employed and unemployed individuals). This result is multiplied by 100 to express it as a percentage, providing a clear snapshot of the health of the labor market.
The following graph and chart demonstrate the stability of the unemployment rate over the past decade. Despite occasional fluctuations, the rate has remained relatively steady, providing a dependable and predictable trend for real estate investors and analysts to consider. The only significant deviation was in 2020, during the COVID-19 shutdown, which further underscores the influence of external factors on the real estate market.
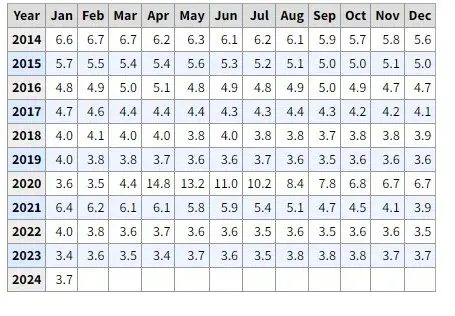
The unemployment rate is a pivotal indicator of an economy’s overall health. A low unemployment rate typically indicates a robust economy with a thriving labor market, while a high unemployment rate may signal economic distress. Policymakers, including government officials and central banks, rely on the unemployment rate to guide monetary policy, fiscal policy, and other interventions to stabilize the economy and reduce unemployment. This underscores the crucial role they play in shaping economic conditions.
2. Labor Force Participation Rate
The following graph and chart refer to the Labor Force Participation Rate (LFPR). It is calculated by dividing the civilian labor force (the blue box plus the yellow box) by the civilian noninstitutional population (gray box) and multiplying the result by 100 to express it as a percentage.
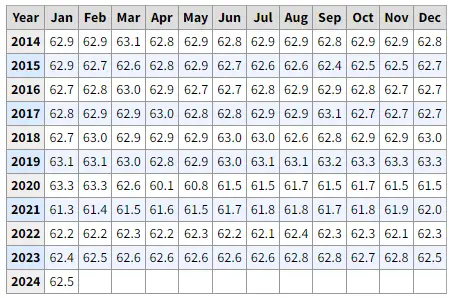
The LFPR measures the proportion of the working-age population that is actively engaged in the labor market. A high LFPR can indicate a strong labor market and a more productive economy, while a declining LFPR can signal potential economic challenges. The LFPR affects policy considerations related to workforce development, retirement planning, social security, and other social welfare programs. Policymakers use this information to design and adjust policies addressing workforce needs.
Since 2000, the LFPR went from a high of 67.1% to 62.5% at the end of 2023. That is startling. If we look at the actual number of people affected by the drop in the LFPR, there should be 179.1 million rather than 167.1 million in the labor force. To work this differently, 12 million have dropped out of the labor force and are not looking for employment.
3. The Employment-Population Ratio
The next graph and chart report the employment-population ratio, which is slightly different from the LFPR. It is calculated by dividing the total employed by the civilian noninstitutional population (dividing the blue box by the gray box) and then multiplying the result by 100 to express it as a percentage. That calculation differs from the LFPR because it does not include the unemployed (the yellow box).
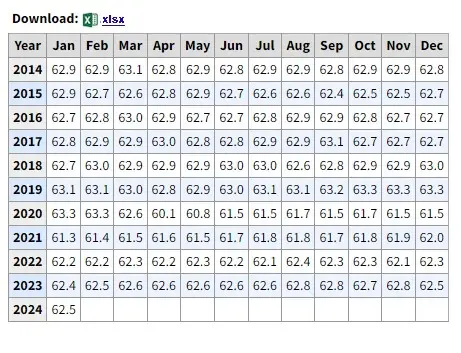
The employment-population ratio offers a direct assessment of the degree to which individuals in the working-age population are actively participating in the labor force by being employed. It reflects the availability of jobs and the success of individuals in finding work. A high employment-population ratio indicates a greater degree of economic well-being within a society, as more people contribute to the workforce and potentially earn an income.
4. Not In the Labor Force
Let’s now look specifically at the portion of the labor force that is not included in any of the calculations. (the pink box). The “not in the labor force” category refers to individuals not classified as employed or unemployed (individuals unemployed for more than four weeks). This group typically includes people not actively seeking employment and, therefore, not considered part of the labor force. This might consist of retired individuals, students, individuals who have chosen not to work, or those who cannot work due to disability or other reasons. Arguably, it can include individuals who would rather not work and collect unemployment benefits. Economic conditions or personal circumstances may discourage some individuals from finding work, causing them to stop actively seeking employment and move into the “not in the labor force” category. If the LFPR decreases, the demand for real estate will be dampened.
To fully grasp the importance of this category and the impact it has on the real estate market, let’s not talk about percentages; instead, let’s talk about the people in this category. Today, the total number of people “not in the labor force” is 99.8 million. Again, these people are not working and not looking for employment. Compare that to the total number of unemployed people, 6.1 million, and reported in unemployment numbers. Added together, the total is 105.9 million.
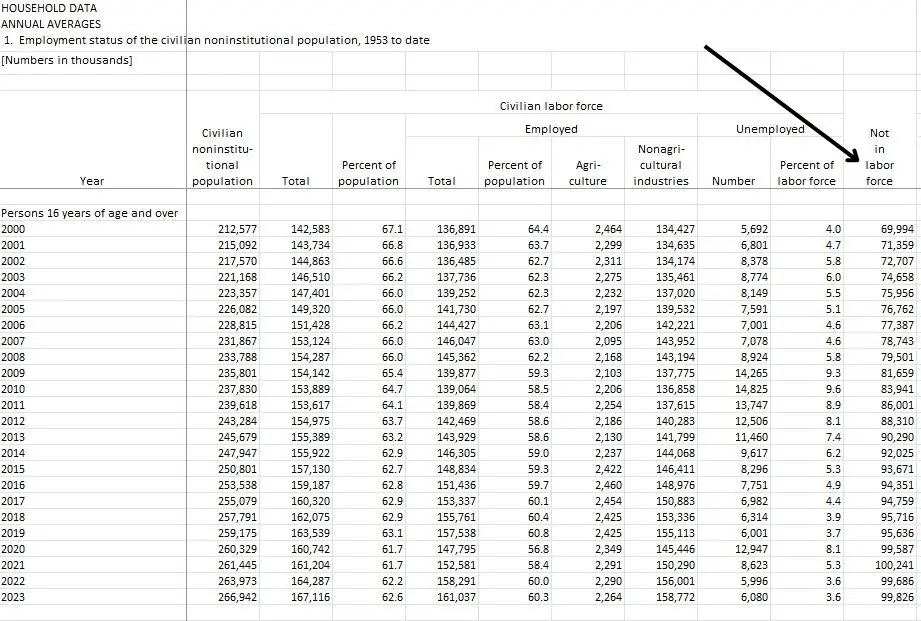
99,826,000 Not in the Labor Force PLUS 6,080,000 Unemployed EQUALS a total of 105,900,000 unemployed!
Final Thoughts
The news reports that we have an excellent economy. After all, the unemployment rate is 3.7%, and a labor shortage is reported. On a certain level, that is excellent and may indicate a healthy real estate market. But does it tell the whole story? The obvious answer is no.
If our nation’s aim is to increase the number of people working and the nation’s productivity, the focus should be on increasing the number of jobs and less on rewarding people for not working.
Hopefully, we will be on the right track for a better economy, incomes will increase, and home ownership will become more affordable.


